I’d figured out the basics of unit testing with Pytest, but then wanted to be able to generate code coverage statistics and visualise them in VSCode. What follows is the executive summary of my findings :)
Firstly I created a new virtual environment to keep the packages that I was installing separate from the system-installed packages, installed pytest and pytest-cov, and then saved the list of dependencies that had been installed to requirements.txt.
  wobble@Boop:~/coverage$ python3 -m venv .venv
  wobble@Boop:~/coverage$ source .venv/bin/activate
  (.venv) wobble@Boop:~/coverage$ pip3 install pytest pytest-cov
  Collecting pytest
    Using cached pytest-7.1.2-py3-none-any.whl (297 kB)
  Collecting pytest-cov
    Using cached pytest_cov-3.0.0-py3-none-any.whl (20 kB)

  ... snip ...

  Installing collected packages: pyparsing, tomli, py, pluggy, packaging, iniconfig, coverage, attrs, pytest, pytest-cov
  Successfully installed attrs-21.4.0 coverage-6.4.1 iniconfig-1.1.1 packaging-21.3 pluggy-1.0.0 py-1.11.0 pyparsing-3.0.9 pytest-7.1.2 pytest-cov-3.0.0 tomli-2.0.1
  (.venv) wobble@Boop:~/coverage$ pip3 freeze > requirements.txt
I had my code in a mysteriously-named subdirectory called app as well as a file containing some unit tests:
# utilities.py
def is_entertaining(number: int) -> bool:
    if (number % 3 == 0):
        return True
    elif (number % 5 == 0):
        return True
    else:
        return False
# utilities_test.py
from utilities import is_entertaining
def test_multiple_of_threes_are_entertaining():
assert True == is_entertaining(3)
def test_other_numbers_are_not_entertaining():
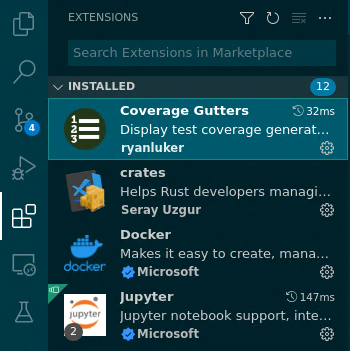
assert False == is_entertaining(7)In VSCode, I installed the Coverage Gutters extension:
I added a pytest.ini file to the root of my project which specified some extra arguments that should be used when running pytest. This tells pytest-cov where my project is, and to generate an XML coverage data file:
[pytest]
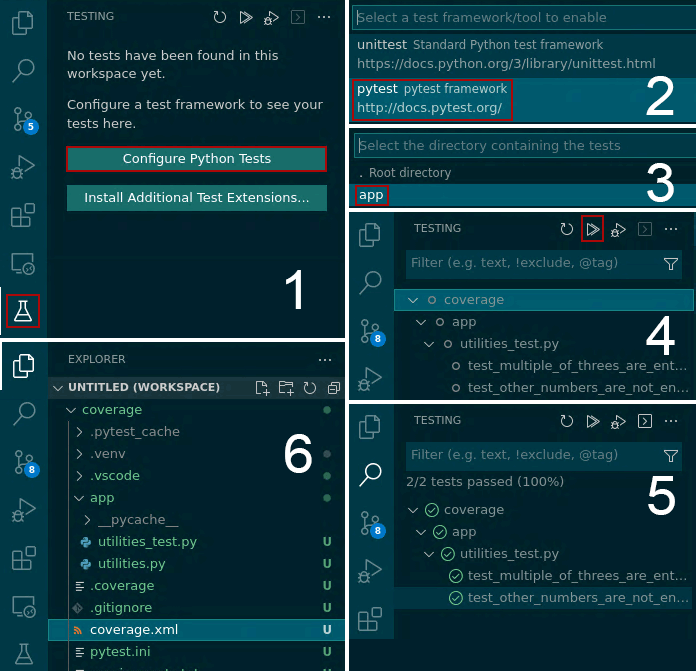
addopts = --cov=app --cov-report xmlFollowing that, I configured testing within VSCode via the “Configure python tests” button in the testing tab, and then ran the tests resulting in lots of green ticks as well as the appearance of a coverage.xml file containing the coverage data:
With this in place, the coverage data visualisations could be toggled by hitting the “Watch Now” button in the footer resulting in green/red bars showing line-by-line coverage as well as a figure in the footer showing the percentage coverage for the currently-open file:
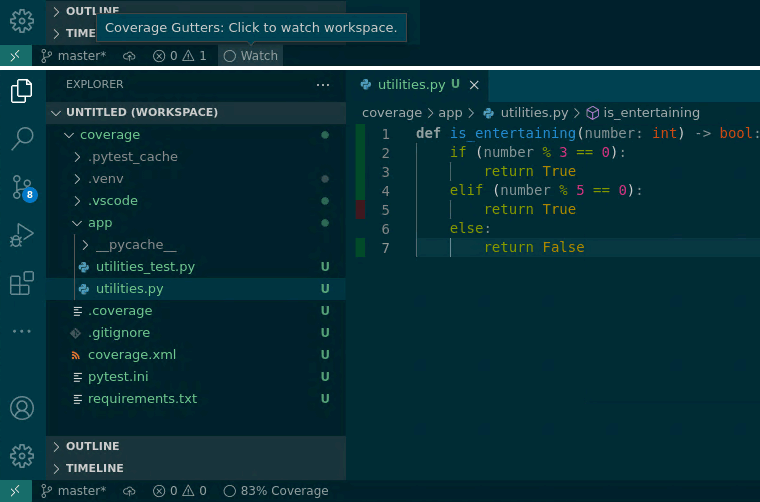
Here we can see that my tests cover 83% of utilities.py and that I need to write a test to cover the case where the number passed is divisible by five :)
Comments